
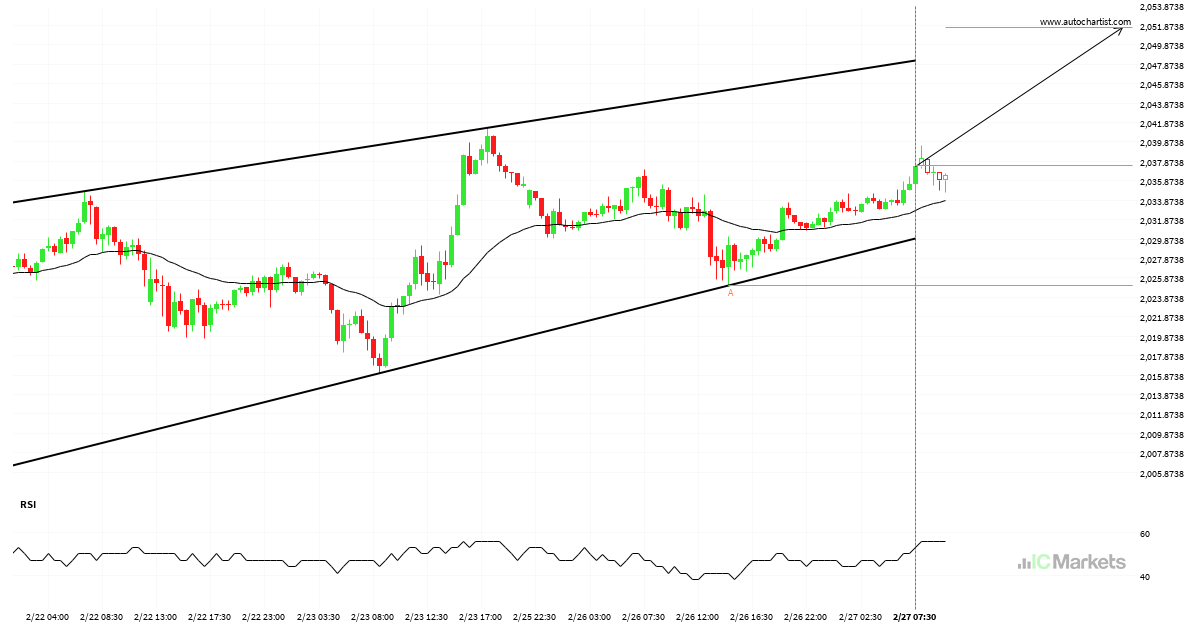
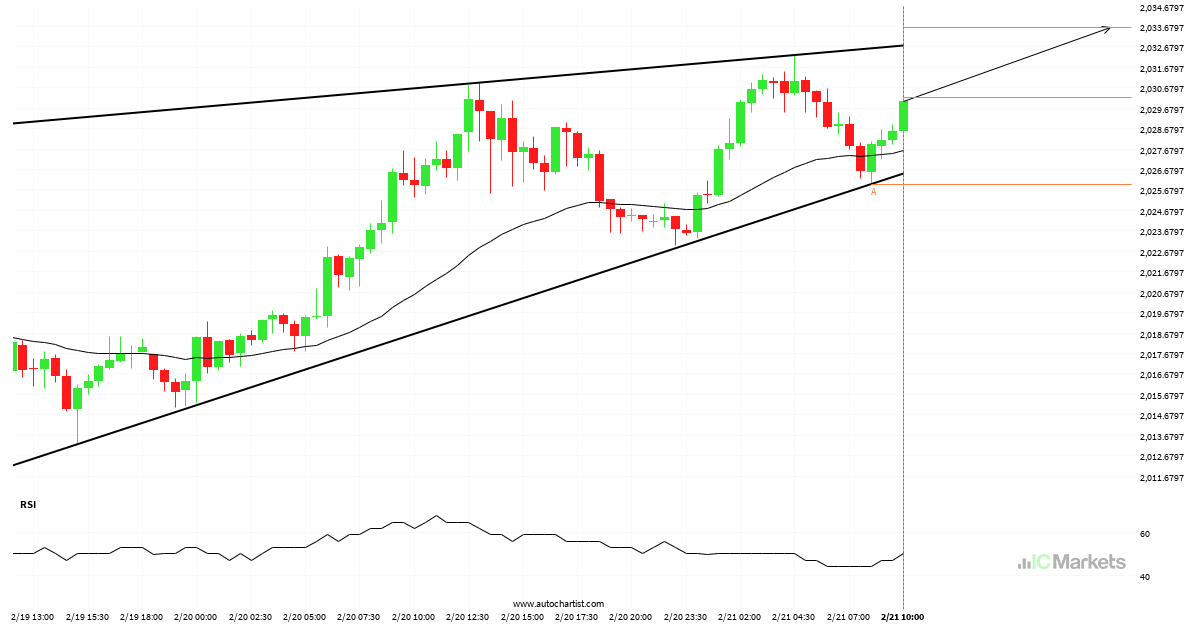
GOLD – Continuation Chart Pattern – Rising Wedge
Emerging Rising Wedge pattern in its final wave was identified on the GOLD 30 Minutes chart. After a strong bullish run, we find GOLD heading towards the upper triangle line with a possible resistance at 2051.6223. If the resistance shows to hold, the Rising Wedge pattern suggests a rebound back towards current levels.

Possibility of big movement expected on GOLD
Triangle pattern identified on GOLD has broken through a support level with the price momentum continuing to move in an downward direction. A solid trading opportunity continues with the price expected to reach 2028.9219 in the next 5.
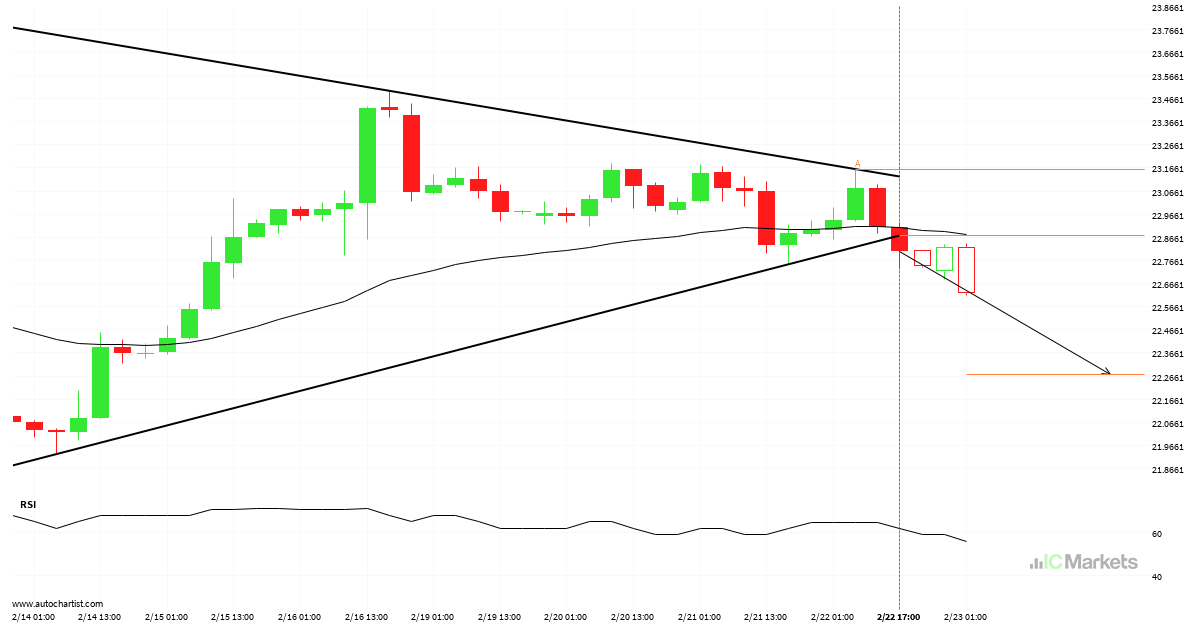
Triangle breakout on SILVER
SILVER has broken through the support line which it has tested twice in the past. We have seen it retrace from this line before, so one should wait for confirmation of the breakout before trading. If this new trend persists, a target level of around 22.2743 may materialize within the next 2 days.
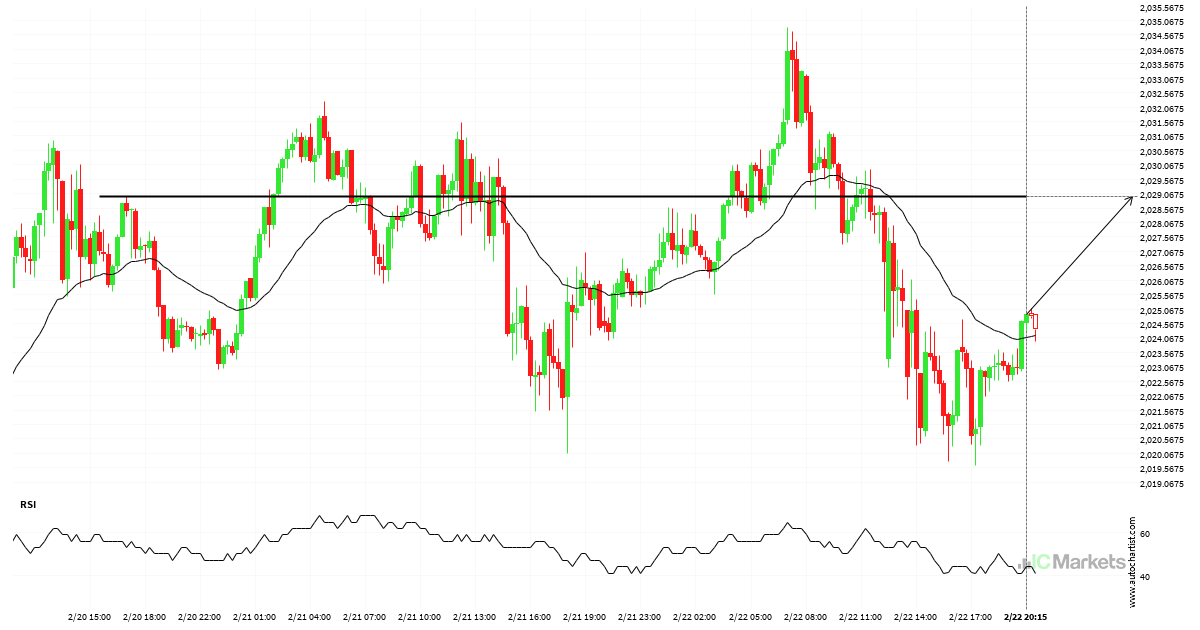
GOLD approaches important level of 2028.9600
GOLD is heading towards 2028.9600 and could reach this point within the next 12 hours. It has tested this line numerous times in the past, and this time could be no different, ending in a rebound instead of a breakout. If the breakout doesn’t happen, we could see a retracement back down to current levels.
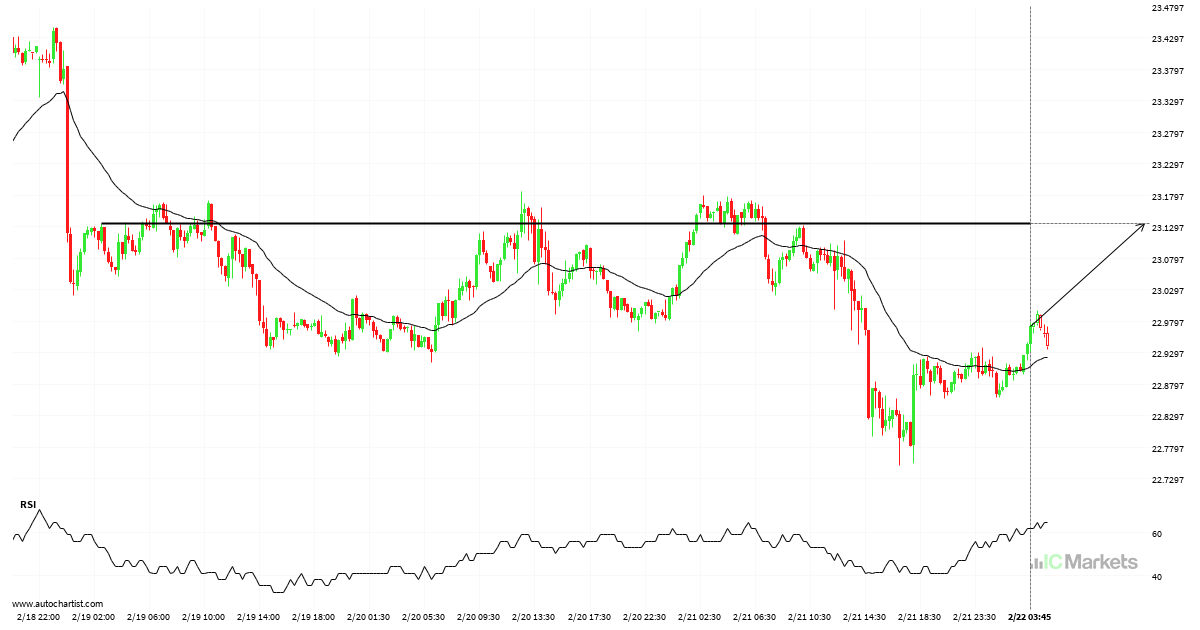
Either a rebound or a breakout imminent on SILVER
The price of SILVER in heading back to the resistance area. It is possible that it will struggle to break through it and move back in the other direction. The price may eventually break through, but typically the price retreats from the level a number of times before doing so.
GOLD – getting close to resistance of a Rising Wedge
GOLD is moving towards a resistance line which it has tested numerous times in the past. We have seen it retrace from this line before, so at this stage it isn’t clear whether it will breach this line or rebound as it did before. If GOLD continues in its current trajectory, we could see it […]
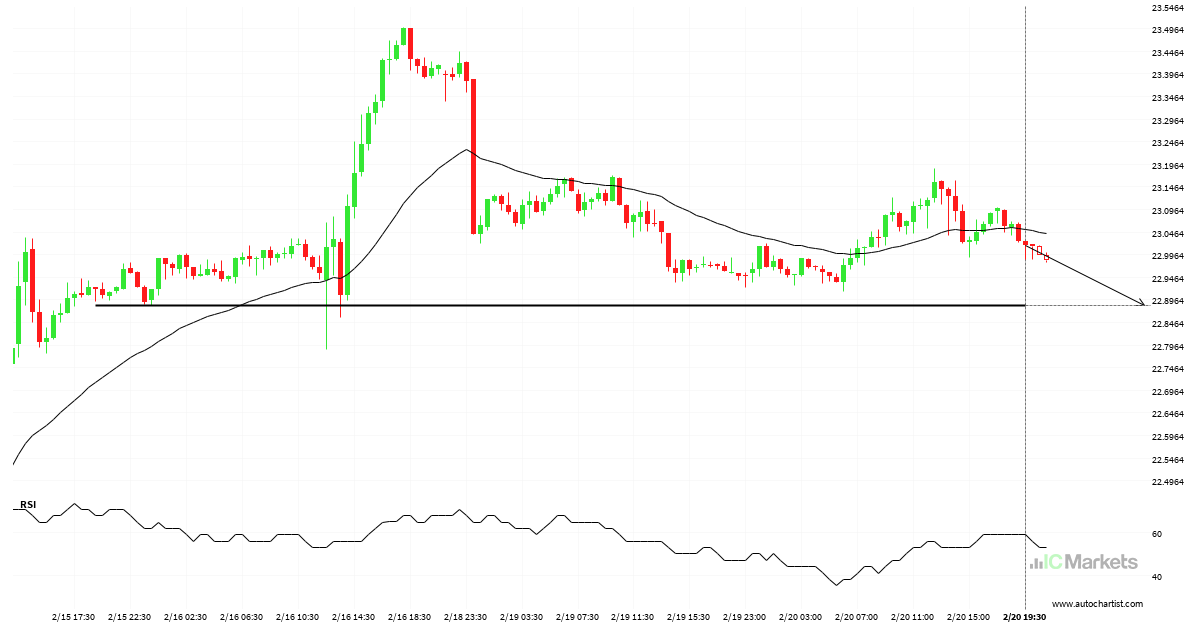
SILVER – getting close to psychological price line
SILVER is about to retest a key horizontal support level near 22.8840. It has tested this level 8 times in the recent past and could simply bounce off like it did last time. However, after this many tries, maybe it’s ready to start a new trend.
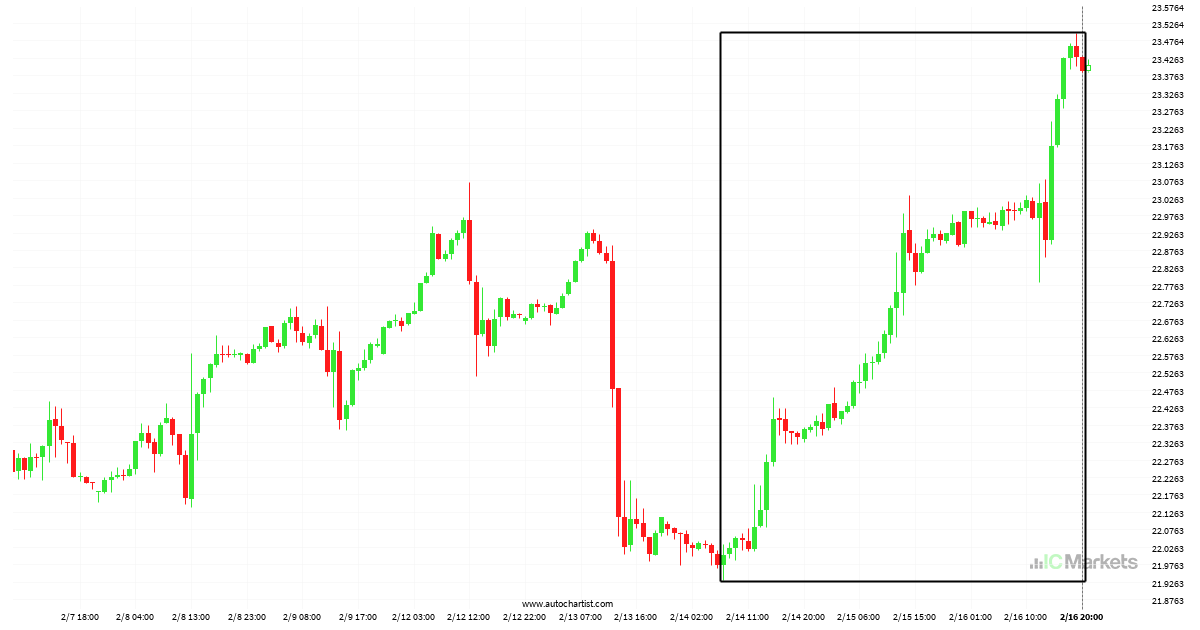
Huge movement on SILVER, did you miss it?
SILVER hits 23.388 after a 6.29% move spanning 3 days.
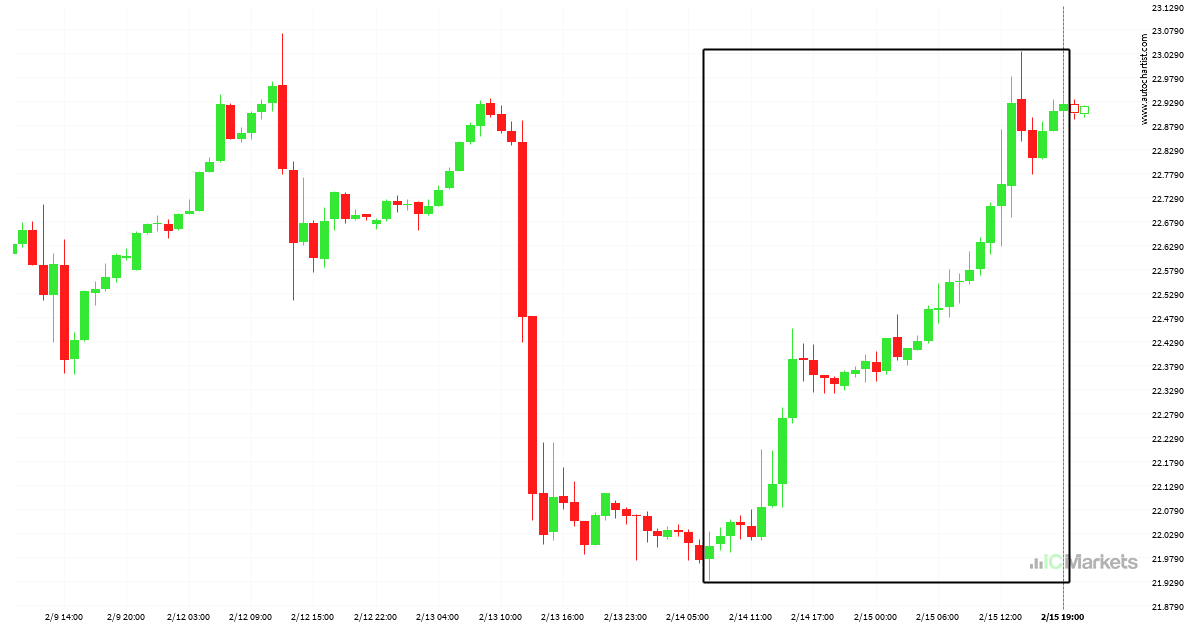
Dramatic change in SILVER. A sign of things to come?
SILVER hits 22.923 after a 4.18% move spanning 2 days.
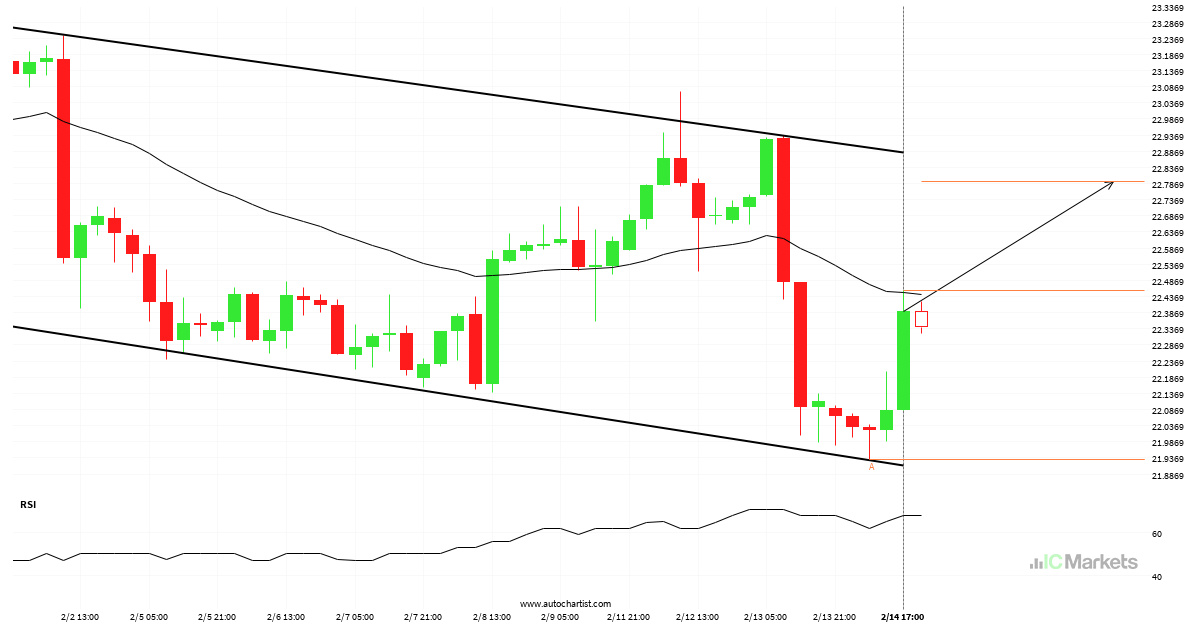
Possible breach of resistance level by SILVER
A Channel Down pattern was identified on SILVER at 22.456, creating an expectation that it may move to the resistance line at 22.7935. It may break through that line and continue the bullish trend or it may reverse from that line.